Hi traders!
There are a few outstanding charts there for day-traders, and a few for swing traders. From high quality to decent, here they are:
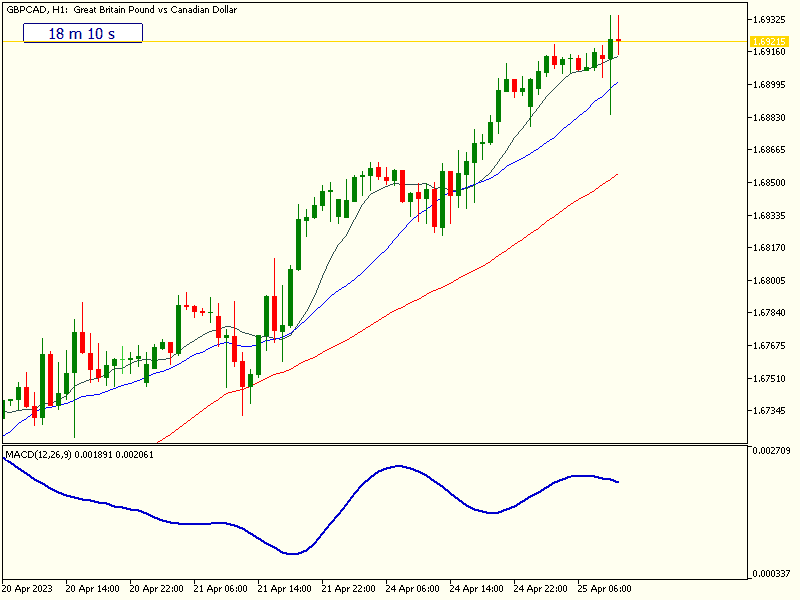
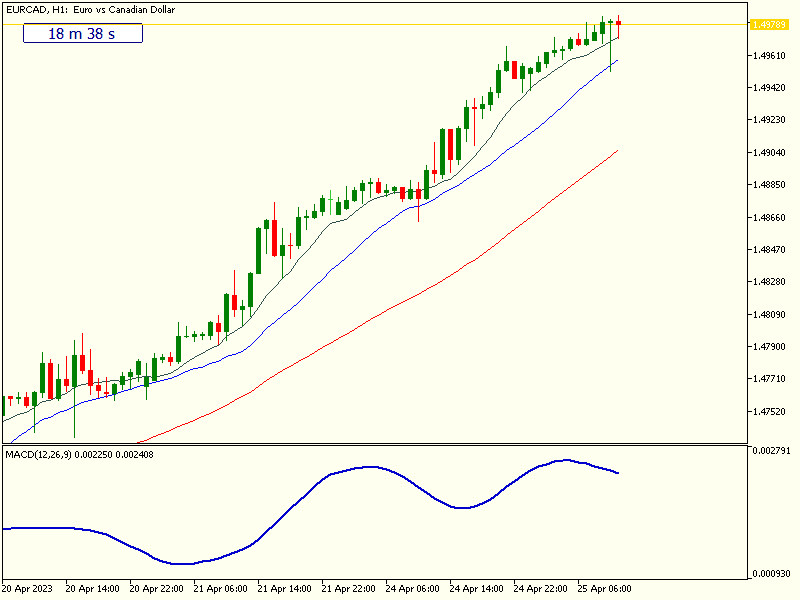
EURCAD & GBPCAD 4-hour charts show very strong, ‘optimal’ price action behaviour.
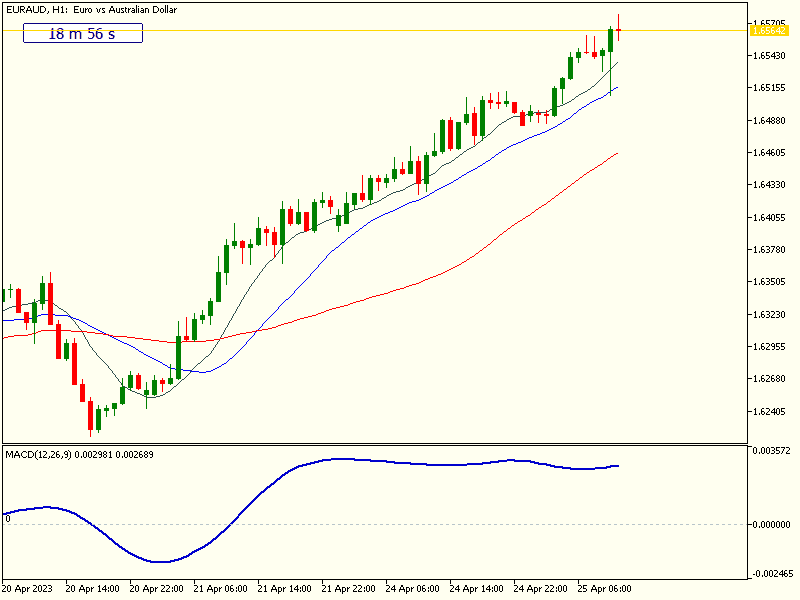
With EURAUD & GBPAUD 4-hourly following close behind.
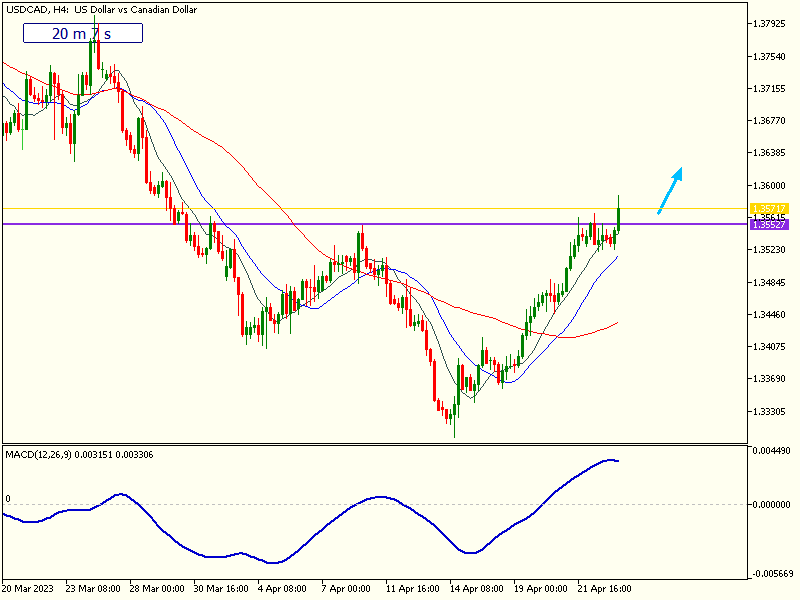
USDCAD 4-hour chart also shows a break above major resistance, and a retest of that level will be watched closely by bullish trend traders.
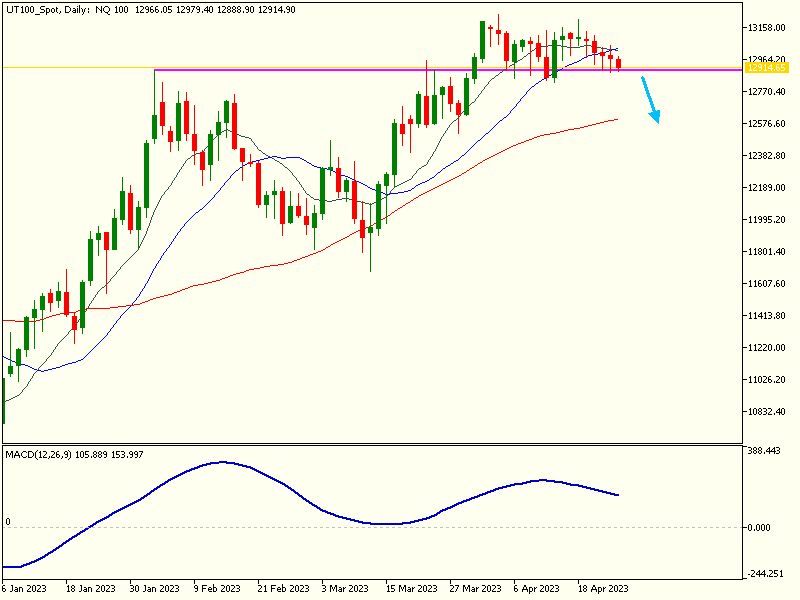
The Tech 100 daily may be about to break below support. I say ‘may’. It doesn’t count until it does.
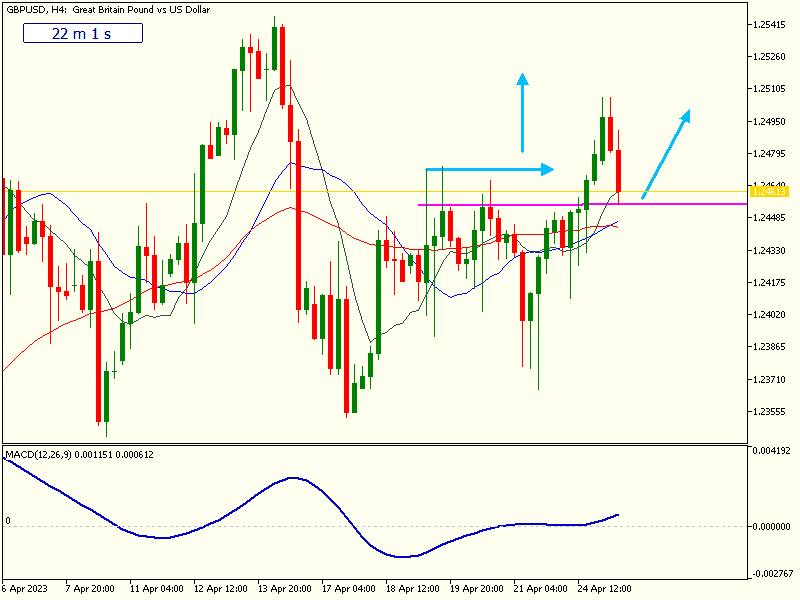
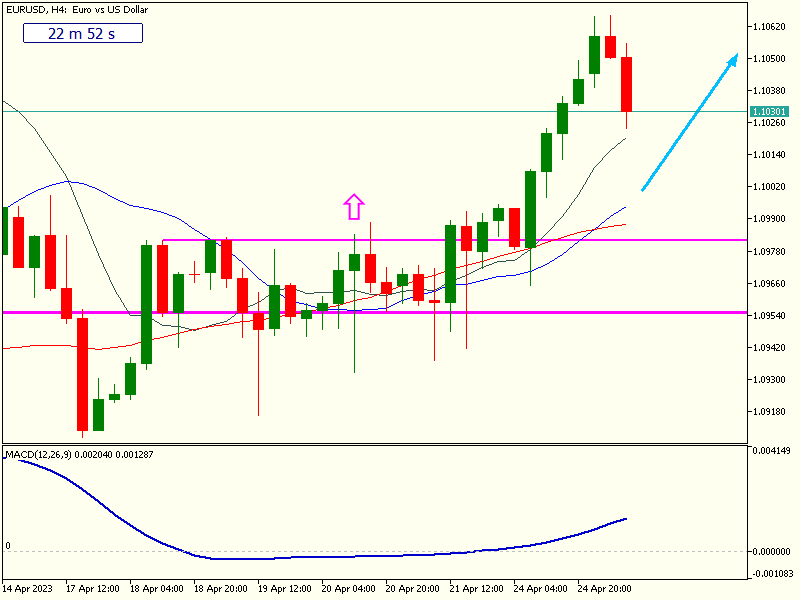
Both EURUSD & GBPUSD 4-hourly charts have managed to break higher (as discussed here last week) and are retracing. Will they for bullish setups before resuming the next leg up?
Happy Trading!