Hi traders!
Gold has had a great run lately, and as we all know, what goes up must come down (eventually).
As a day-trader, I tend to monitor the 4-hour timeframe for clues about the Daily.
Each trading day, in London, usually has only three 4-hour candles, that’s about 15 in a trading week.
It’s not normal for a trader to trade from 6am until 10pm; most traders will operate from either 6am to 5pm (day traders), or 4pm-12pm (for swing traders).
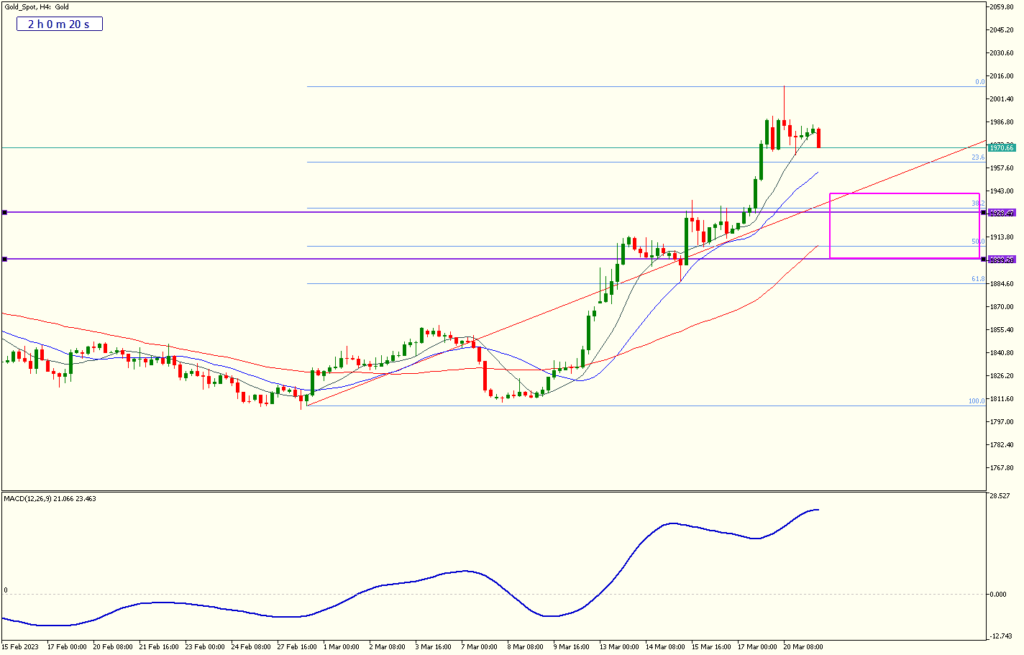
Gold’s chart shows price considering retracing lower temporarily as part of its larger uptrend.
There are two recognisable levels of support & resistance below price, both of which could feasibly attract Gold if it heads lower, in order to test one or both of those levels for support.
Interestingly, if a Fibonacci measurement is overlaid, then the 38.2% and 50% levels also overlap closely with these S/R levels, adding to the idea that either level could provide a base if Gold is to continue trending higher after a minor correction.
I’ll be watching these areas for bullish candlesticks and any other price action signals that are part of my trend-based trading strategy.
Happy Trading!